Understanding the pollutants
A breath of fresh air for Ealing
The air quality in the UK, London and the borough of Ealing has significantly improved in recent years.
This is down to stricter regulations governing emissions from industries, households, and transportation.
Yet, there's more we can achieve together to make the air we breathe even cleaner and healthier.
Understanding the battle against air pollution
These are the pollutants that most commonly affect our air quality today:
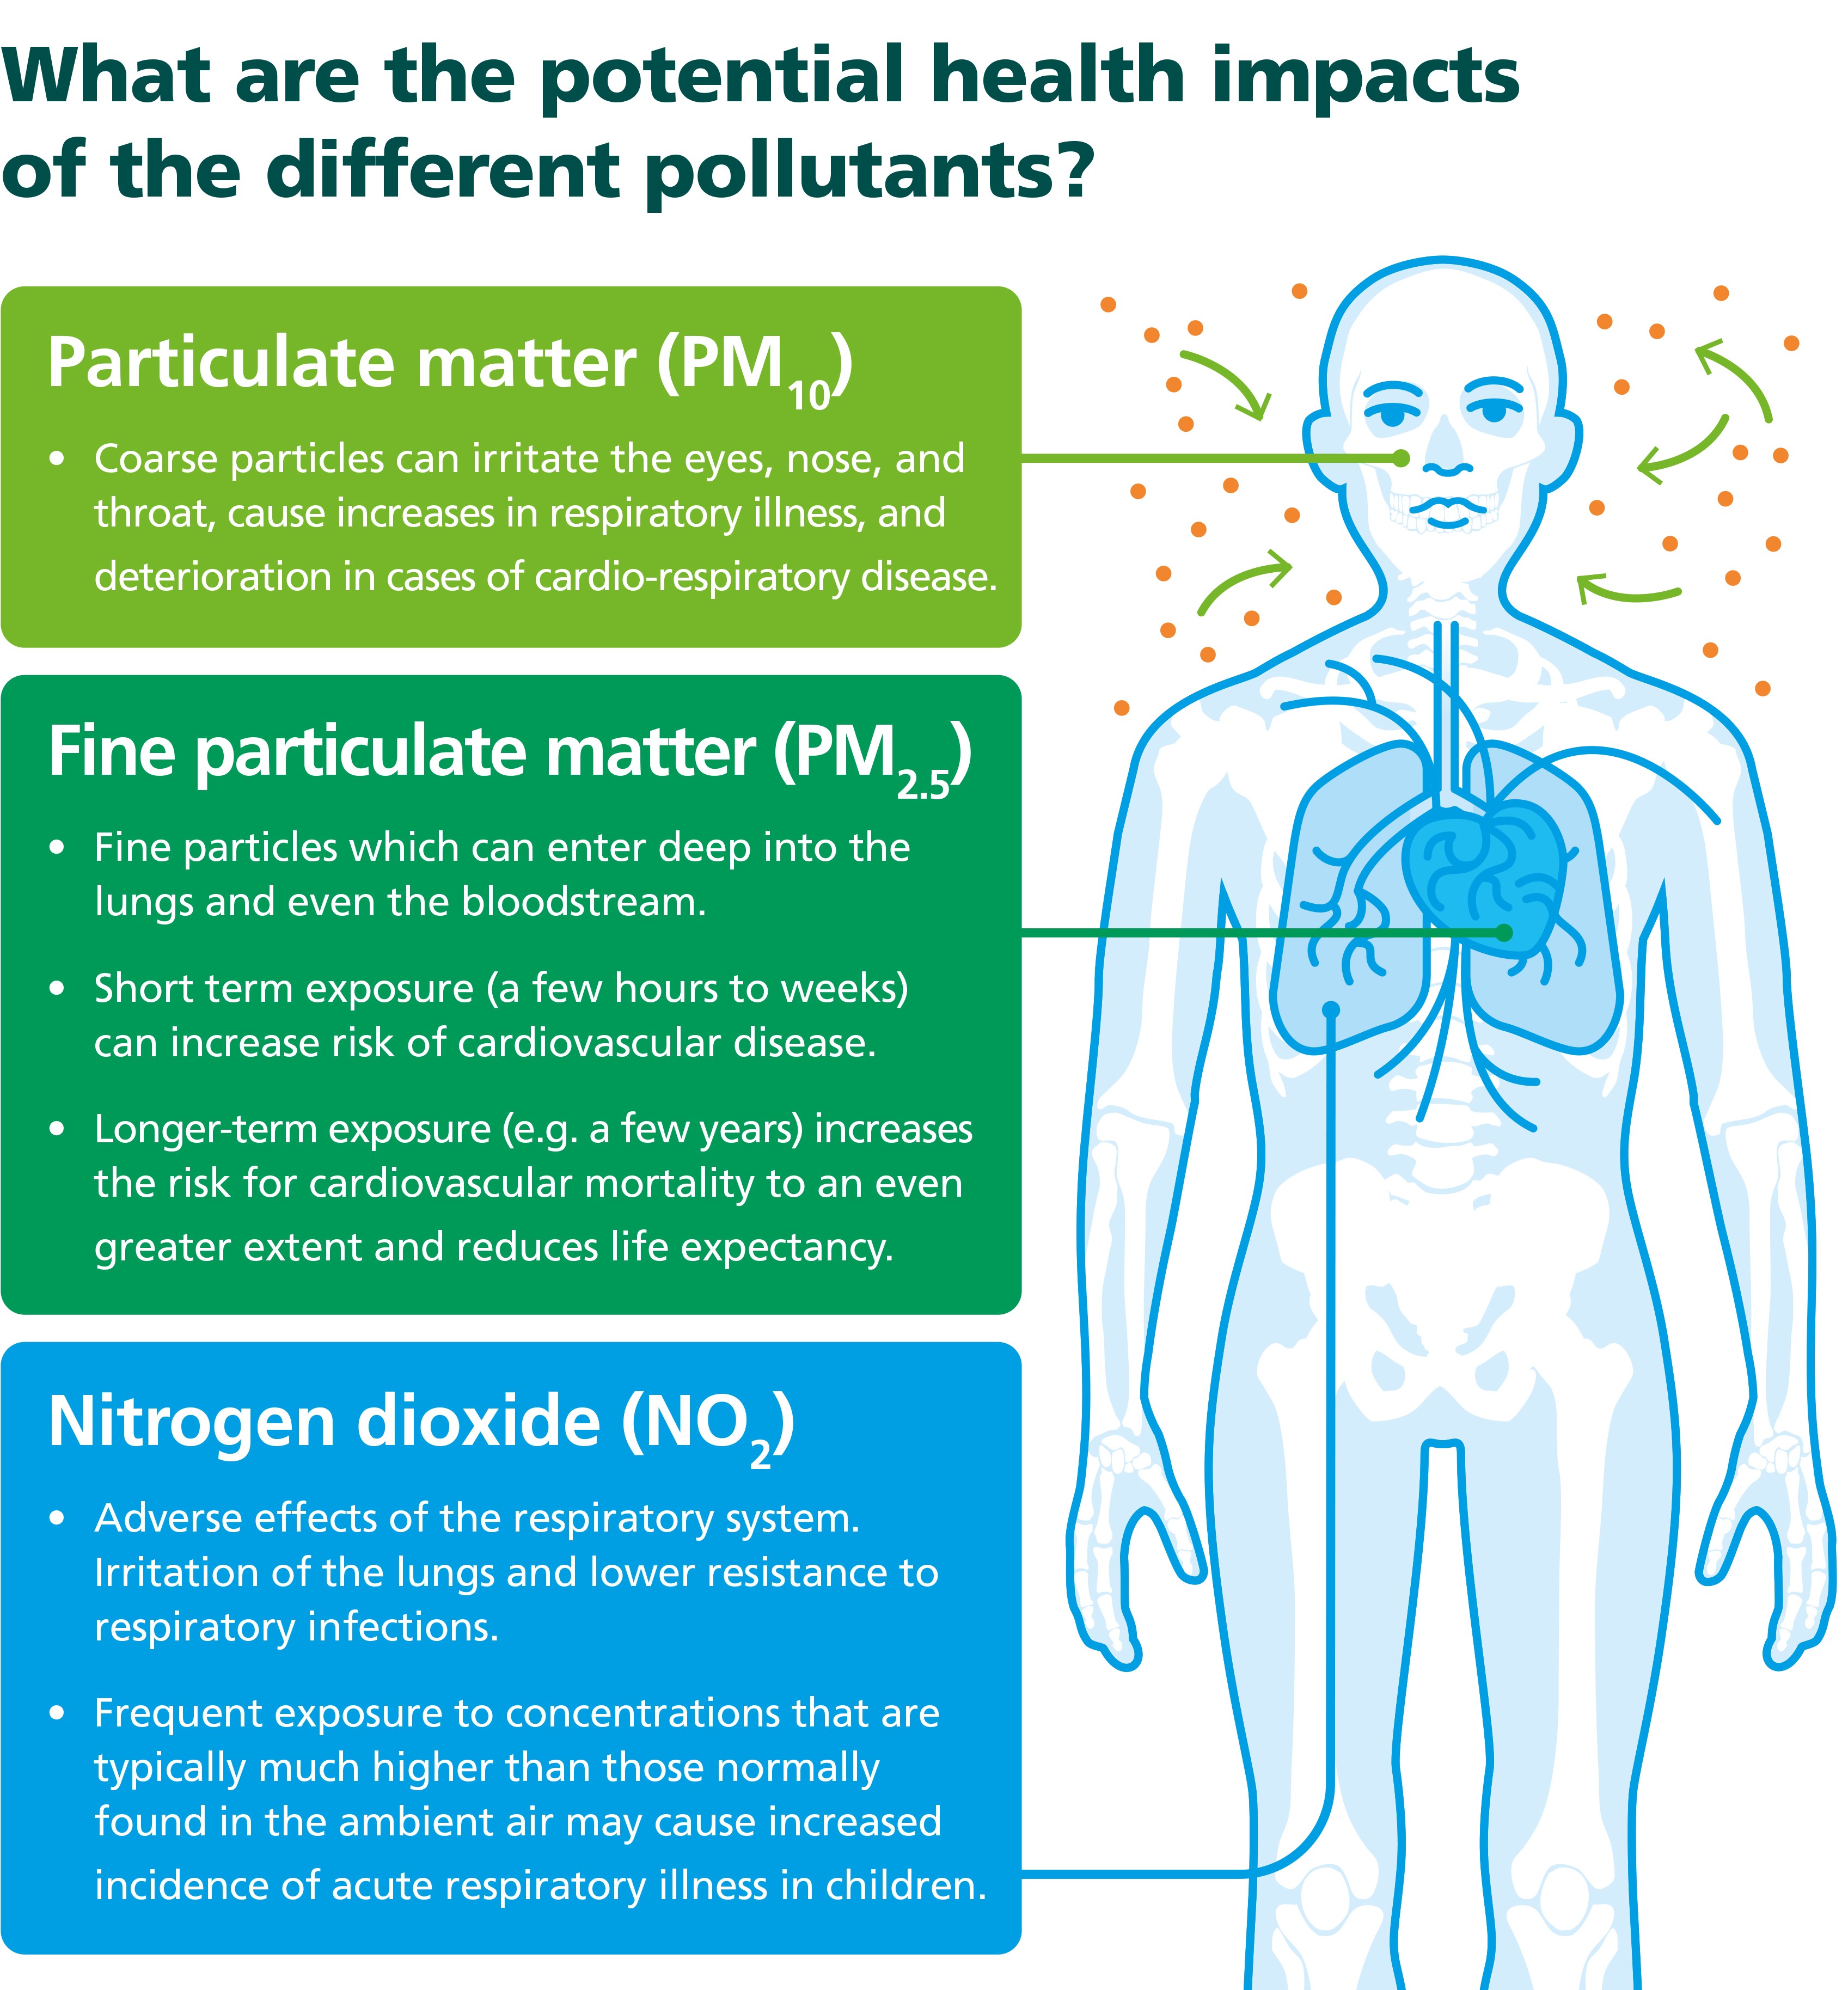
- Nitrogen oxides: these pollutants, mainly from road transport and combustion processes, can transform into harmful substances like nitrogen dioxide (NO2), which irritates our lungs and increases respiratory infections, particularly in children.
- Fine particles: these tiny particles suspended in the air, often originating from road traffic, construction, and even natural sources like dust and pollen, can cause inflammation in our airways, worsening heart and lung conditions. They are classified based on their size:
- PM10 refers to particles with a diameter of less than 10 micrometers.
- PM2.5 refers to particles with a diameter of less than 2.5 micrometers.
- Ozone: while not emitted directly, ozone forms due to complex chemical reactions involving sunlight and certain compounds. Ozone can exacerbate asthma and lung diseases, especially in areas with high levels of nitrogen oxides, volatiles organic compounds and sunlight.
- Volatile Organic Compounds (VOCs): VOCs, emitted from sources like fuel combustion and solvent use, contribute to the formation of ozone and can lead to serious health effects, including cancer, central nervous system disorders, and birth defects.
Where does it all come from?
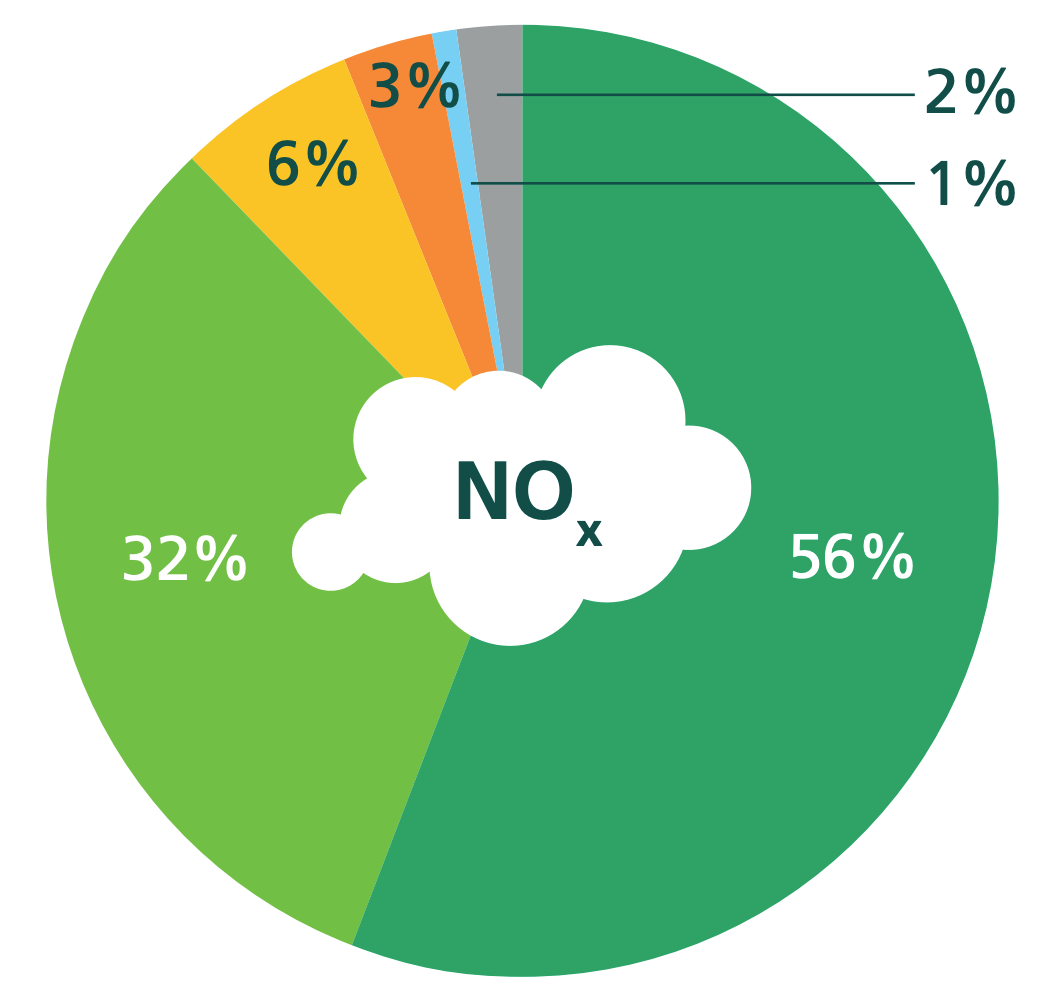
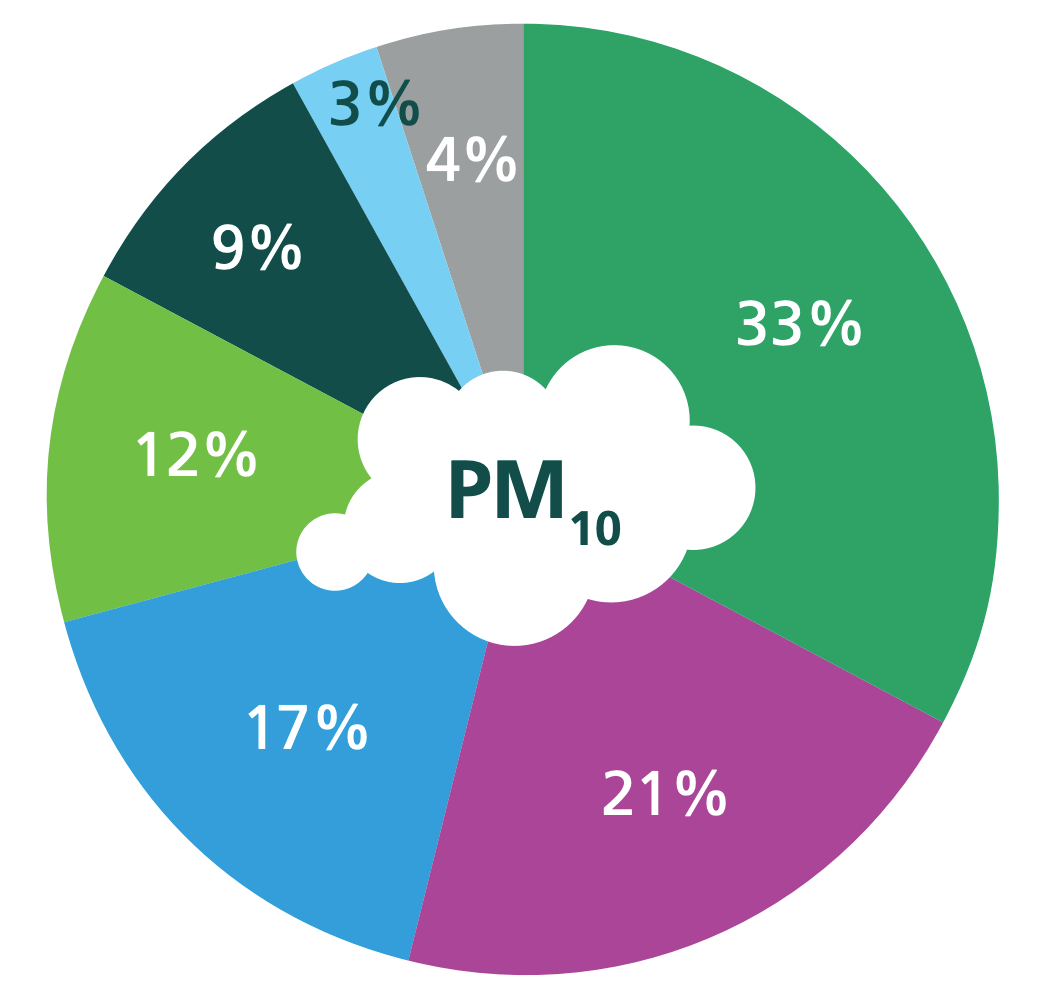
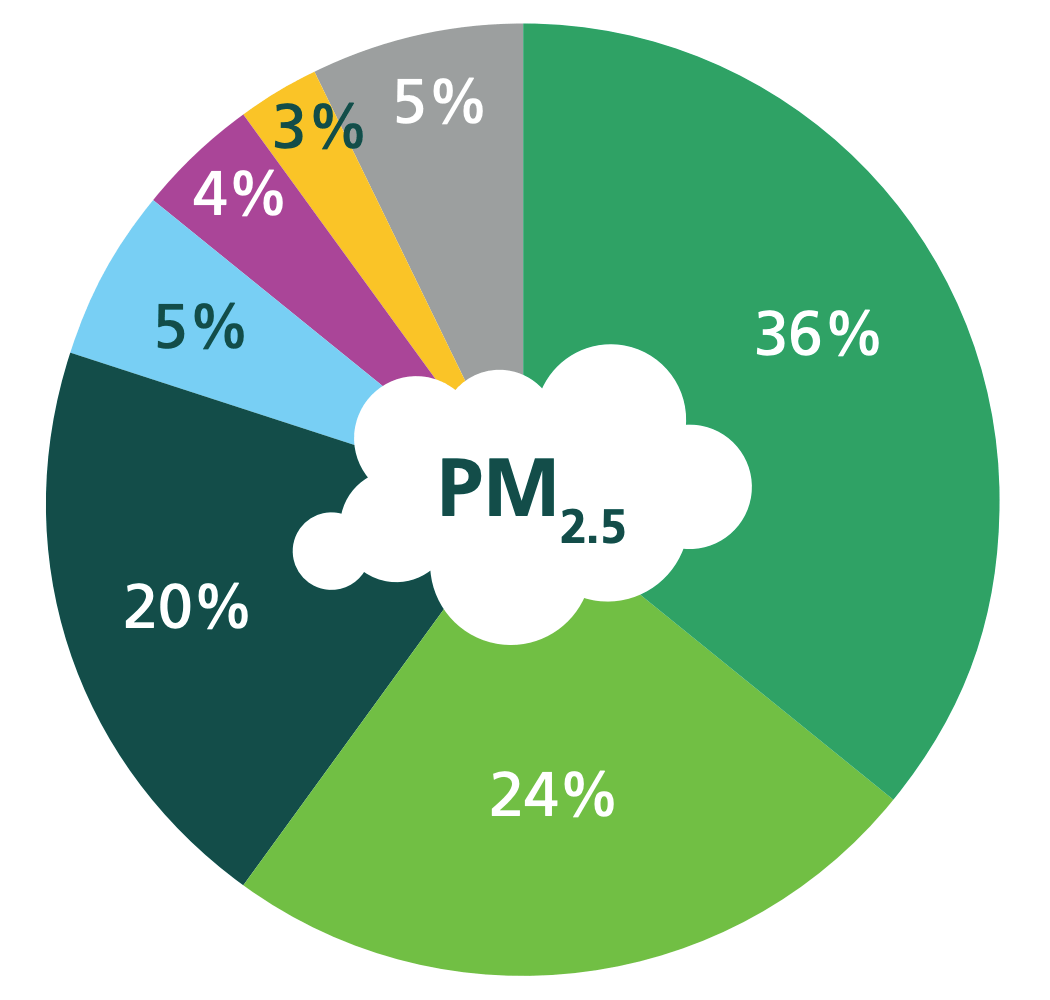
The main source of pollution in Ealing is through road transport, it contributes around 56% of NOx emissions, 33% and 36% of PM10 and PM22.5 emissions respectively. Domestic and commercial combustion from gas, coal and oil are the second biggest contributor to NOx and PM2.5 emissions. We also see that for PM10 emissions, construction dust is the second largest contributor in Ealing at around 21%. In recent years we have seen increase of domestic wood burning and it contributes to around 20% of PM2.5 emissions.
Primary emission sources of NOx, PM2.5 and PM10 in Ealing (based on LAEI 2019 data)